概述
为什么要写这个小结?
- MPAndroidChart文档是英文的,demo没有注释。
- 为了让以后使用MPAndroidChart更加方便。
MPAndroidChart简介
项目地址
https://github.com/PhilJay/MPAndroidChart
我用的版本
1
| compile 'com.github.PhilJay:MPAndroidChart:v3.0.2'
|
用法总结
折线图/曲线图(LineChart)
1
2
3
4
5
6
7
8
9
10
11
12
13
14
15
16
17
18
19
20
21
22
23
|
weekChart.setDrawGridBackground(false);
weekChart.setDrawBorders(false);
weekChart.setDrawMarkers(false);
weekChart.getLegend().setEnabled(false);
weekChart.getDescription().setEnabled(false);
weekChart.setNoDataText(getString(R.string.no_data));
weekChart.getXAxis().setPosition(XAxis.XAxisPosition.BOTTOM);
weekChart.getXAxis().setDrawGridLines(false);
weekChart.getAxisRight().setEnabled(false);
weekChart.getAxisLeft().setDrawGridLines(false);
weekChart.getAxisLeft().setDrawLabels(true);
|
1
2
3
4
|
weekChart.getXAxis().setAxisMinimum(-0.5f);
weekChart.getXAxis().setAxisMaximum(week.size()-0.5f);
|
1
2
|
weekChart.getXAxis().setLabelCount(week.size());
|
1
2
3
4
5
6
7
8
9
10
11
12
13
14
15
16
17
18
19
20
21
22
23
24
25
26
27
28
29
30
31
32
33
34
35
36
37
38
39
40
41
42
43
44
45
46
47
48
49
50
| private void updateWeek(final List<GetDefectiveRateResult.DataEntity.WeekEntity> week) {
if (week != null && week.size() > 0) {
weekChart.getXAxis().setAxisMinimum(-0.5f);
weekChart.getXAxis().setAxisMaximum(week.size()-0.5f);
weekChart.getXAxis().setLabelCount(week.size());
List<Entry> values = new ArrayList<>();
for (int i = 0; i < week.size(); i++) {
GetDefectiveRateResult.DataEntity.WeekEntity weekEntity = week.get(i);
values.add(new Entry(i, weekEntity.getValue()));
}
weekChart.getXAxis().setValueFormatter(new IAxisValueFormatter() {
@Override
public String getFormattedValue(float value, AxisBase axis) {
return week.get((int) value).getName();
}
});
LineDataSet lineDataSet = new LineDataSet(values, "周废品率(%)");
lineDataSet.setCircleRadius(4f);
lineDataSet.setCircleHoleRadius(3f);
lineDataSet.setCircleColor(getResources().getColor(R.color.colorBarColor));
lineDataSet.setLineWidth(2f);
lineDataSet.setMode(LineDataSet.Mode.CUBIC_BEZIER);
lineDataSet.setColor(getResources().getColor(R.color.colorBarColor));
lineDataSet.setDrawFilled(true);
if (Build.VERSION.SDK_INT >= 18) {
lineDataSet.setFillDrawable(getResources().getDrawable(R.drawable.line_one_shape));
} else {
lineDataSet.setFillColor(0x4f2F7EDB);
}
LineData lineData = new LineData(lineDataSet);
weekChart.setData(lineData);
weekChart.invalidate();
} else {
weekChart.clear();
}
}
|
line_one_shape.xml
1
2
3
4
5
| <?xml version="1.0" encoding="utf-8"?>
<shape xmlns:android="http://schemas.android.com/apk/res/android" android:shape="rectangle">
<gradient android:startColor="#7f2F7EDB" android:angle="270"
android:endColor="@android:color/transparent"/>
</shape>
|
饼状图(PieChart)
1
2
3
4
5
6
7
8
9
10
11
12
13
14
15
16
17
18
19
20
21
22
23
24
25
26
27
28
29
30
31
32
33
34
35
36
37
38
39
40
41
42
43
44
45
46
47
48
49
50
51
52
53
54
55
56
|
reasonPieChart.setNoDataText(getString(R.string.no_data));
reasonPieChart.setUsePercentValues(true);
reasonPieChart.getDescription().setEnabled(false);
reasonPieChart.setExtraOffsets(5, 10, 5, 5);
reasonPieChart.setRotationEnabled(true);
reasonPieChart.setDragDecelerationFrictionCoef(0.95f);
reasonPieChart.setDrawCenterText(true);
reasonPieChart.setCenterText("原因废品率(%)");
reasonPieChart.setDrawHoleEnabled(true);
reasonPieChart.setHoleColor(Color.WHITE);
reasonPieChart.setTransparentCircleColor(Color.WHITE);
reasonPieChart.setTransparentCircleAlpha(110);
reasonPieChart.setHoleRadius(48f);
reasonPieChart.setTransparentCircleRadius(51f);
reasonPieChart.setRotationAngle(0);
reasonPieChart.setDrawEntryLabels(false);
reasonPieChart.setEntryLabelColor(Color.BLACK);
reasonPieChart.setEntryLabelTextSize(7f);
reasonPieChart.getLegend().setEnabled(true);
Legend legend = reasonPieChart.getLegend();
legend.setOrientation(Legend.LegendOrientation.VERTICAL);
legend.setHorizontalAlignment(Legend.LegendHorizontalAlignment.RIGHT);
legend.setVerticalAlignment(Legend.LegendVerticalAlignment.CENTER);
legend.setDrawInside(false);
legend.setTextSize(11f);
|
1
2
3
4
5
6
7
8
9
10
11
12
13
14
15
16
17
18
19
20
21
22
23
24
25
26
27
28
29
30
31
32
| private void updateReason(final List<GetDefectiveRateResult.DataEntity.ReasonEntity> reason) {
if (reason != null && reason.size() > 0) {
List<PieEntry> yVals = new ArrayList<>();
for (int i = 0; i < reason.size(); i++) {
GetDefectiveRateResult.DataEntity.ReasonEntity reasonEntity = reason.get(i);
PieEntry barEntry = new PieEntry(reasonEntity.getValue(), "["+reasonEntity.getValue()+"%] "+reasonEntity.getName());
yVals.add(barEntry);
}
PieDataSet set = new PieDataSet(yVals, "");
ArrayList<Integer> colors = new ArrayList<>();
for (int vordiplomColor : ColorTemplate.VORDIPLOM_COLORS) {
colors.add(vordiplomColor);
}
for (int libertyColor : ColorTemplate.LIBERTY_COLORS) {
colors.add(libertyColor);
}
set.setColors(colors);
set.setValueTextColor(Color.BLACK);
set.setValueLineColor(Color.WHITE);
PieData barData = new PieData(set);
barData.setValueTextSize(7f);
reasonPieChart.setData(barData);
reasonPieChart.invalidate();
} else {
reasonPieChart.clear();
}
}
|
柱状图(BarChart/HorizontalBarChart)
1
2
3
4
5
6
7
8
9
10
11
12
13
14
15
16
17
18
19
20
21
22
23
24
25
26
27
28
29
30
31
32
33
34
35
36
37
38
39
|
reasonBarChart.setDrawBarShadow(false);
reasonBarChart.setDrawValueAboveBar(true);
reasonBarChart.getDescription().setEnabled(false);
reasonBarChart.setPinchZoom(false);
reasonBarChart.setDrawGridBackground(false);
reasonBarChart.getAxisRight().setEnabled(false);
reasonBarChart.getXAxis().setPosition(XAxis.XAxisPosition.BOTTOM);
reasonBarChart.getXAxis().setDrawGridLines(false);
reasonBarChart.getXAxis().setTextSize(9f);
reasonBarChart.getAxisLeft().setDrawGridLines(false);
reasonBarChart.getAxisLeft().setAxisMinimum(0f);
reasonBarChart.getAxisLeft().setEnabled(false);
Legend legend = reasonBarChart.getLegend();
legend.setEnabled(false);
legend.setOrientation(Legend.LegendOrientation.HORIZONTAL);
legend.setHorizontalAlignment(Legend.LegendHorizontalAlignment.RIGHT);
legend.setVerticalAlignment(Legend.LegendVerticalAlignment.CENTER);
legend.setForm(Legend.LegendForm.SQUARE);
legend.setFormSize(9f);
legend.setXEntrySpace(4f);
legend.setDrawInside(false);
legend.setTextSize(11f);
|
1
2
3
4
5
6
| productBarChart.getXAxis().setValueFormatter(new IAxisValueFormatter() {
@Override
public String getFormattedValue(float value, AxisBase axis) {
return product.get((int) value).getName()+" ["+product.get((int) value).getValue()+"%]";
}
});
|
1
2
3
4
5
6
7
8
9
10
11
12
13
14
15
16
17
18
19
20
21
22
23
24
25
26
27
28
29
30
31
32
33
34
35
36
37
38
39
40
41
42
43
44
| private void updateProduct(final List<GetDefectiveRateResult.DataEntity.ProductEntity> product) {
if (product != null && product.size() > 0) {
productBarChart.getXAxis().setLabelCount(product.size());
Collections.reverse(product);
List<BarEntry> yVals = new ArrayList<>();
for (int i = 0; i < product.size(); i++) {
GetDefectiveRateResult.DataEntity.ProductEntity productEntity = product.get(i);
BarEntry barEntry = new BarEntry(i, productEntity.getValue());
yVals.add(barEntry);
}
productBarChart.getXAxis().setValueFormatter(new IAxisValueFormatter() {
    @Override
    public String getFormattedValue(float value, AxisBase axis) {
        return product.get((int) value).getName()+" ["+product.get((int) value).getValue()+"%]";
    }
});
BarDataSet set = new BarDataSet(yVals, "");
ArrayList<Integer> colors = new ArrayList<>();
for (int joyfulColor : ColorTemplate.JOYFUL_COLORS) {
colors.add(joyfulColor);
}
for (int colorfulColor : ColorTemplate.COLORFUL_COLORS) {
colors.add(colorfulColor);
}
set.setColors(colors);
set.setValueTextColor(Color.BLACK);
set.setDrawValues(true);
BarData barData = new BarData(set);
barData.setValueTextSize(7f);
productBarChart.setData(barData);
productBarChart.invalidate();
} else {
productBarChart.clear();
}
}
|
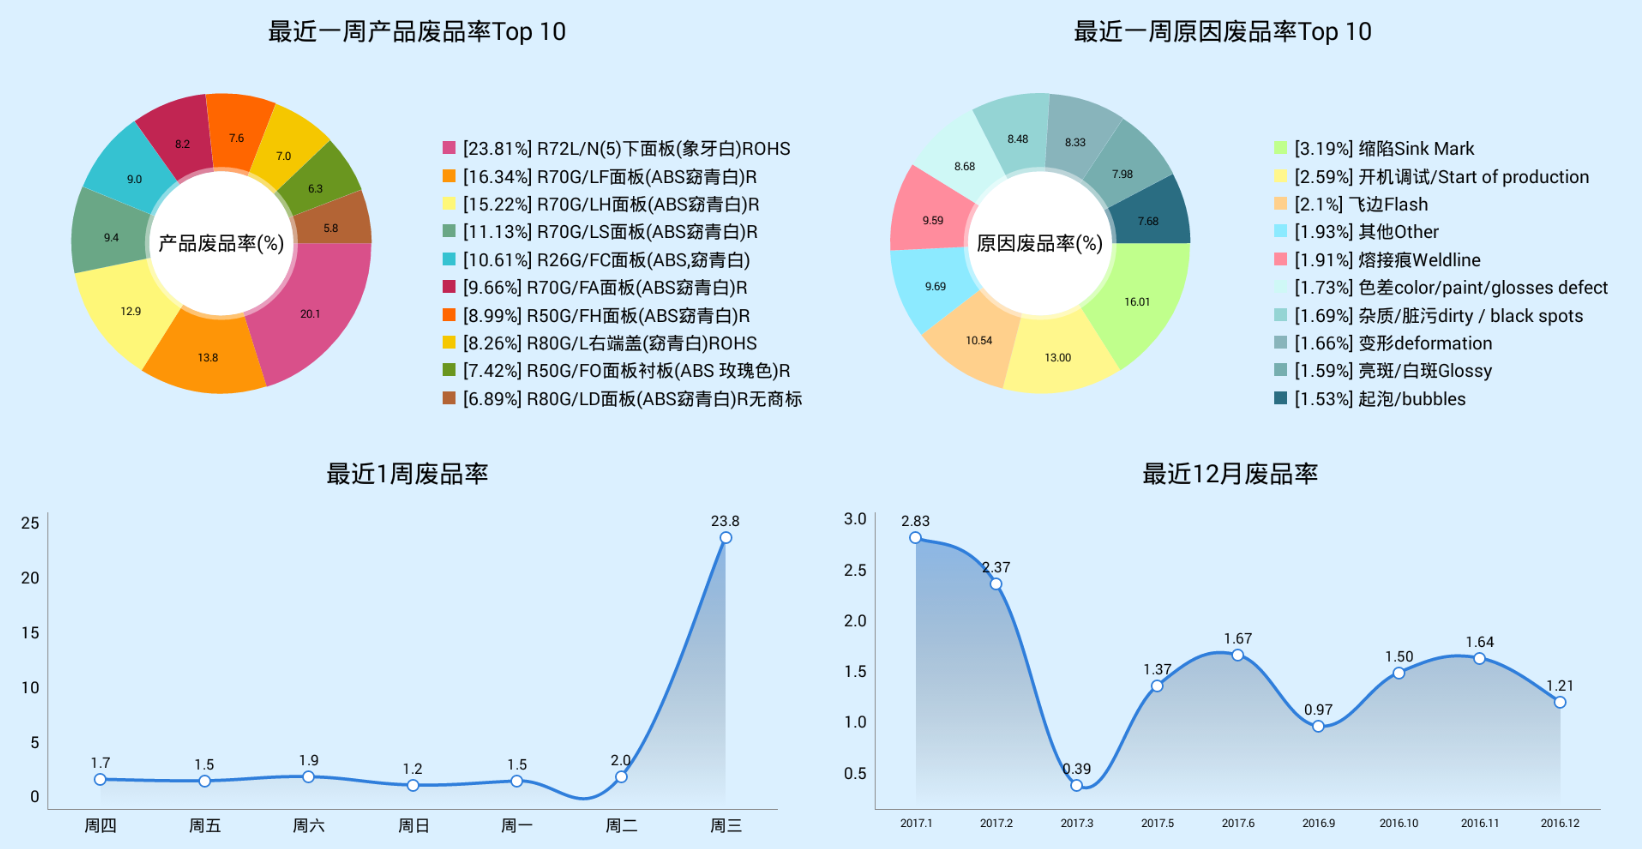
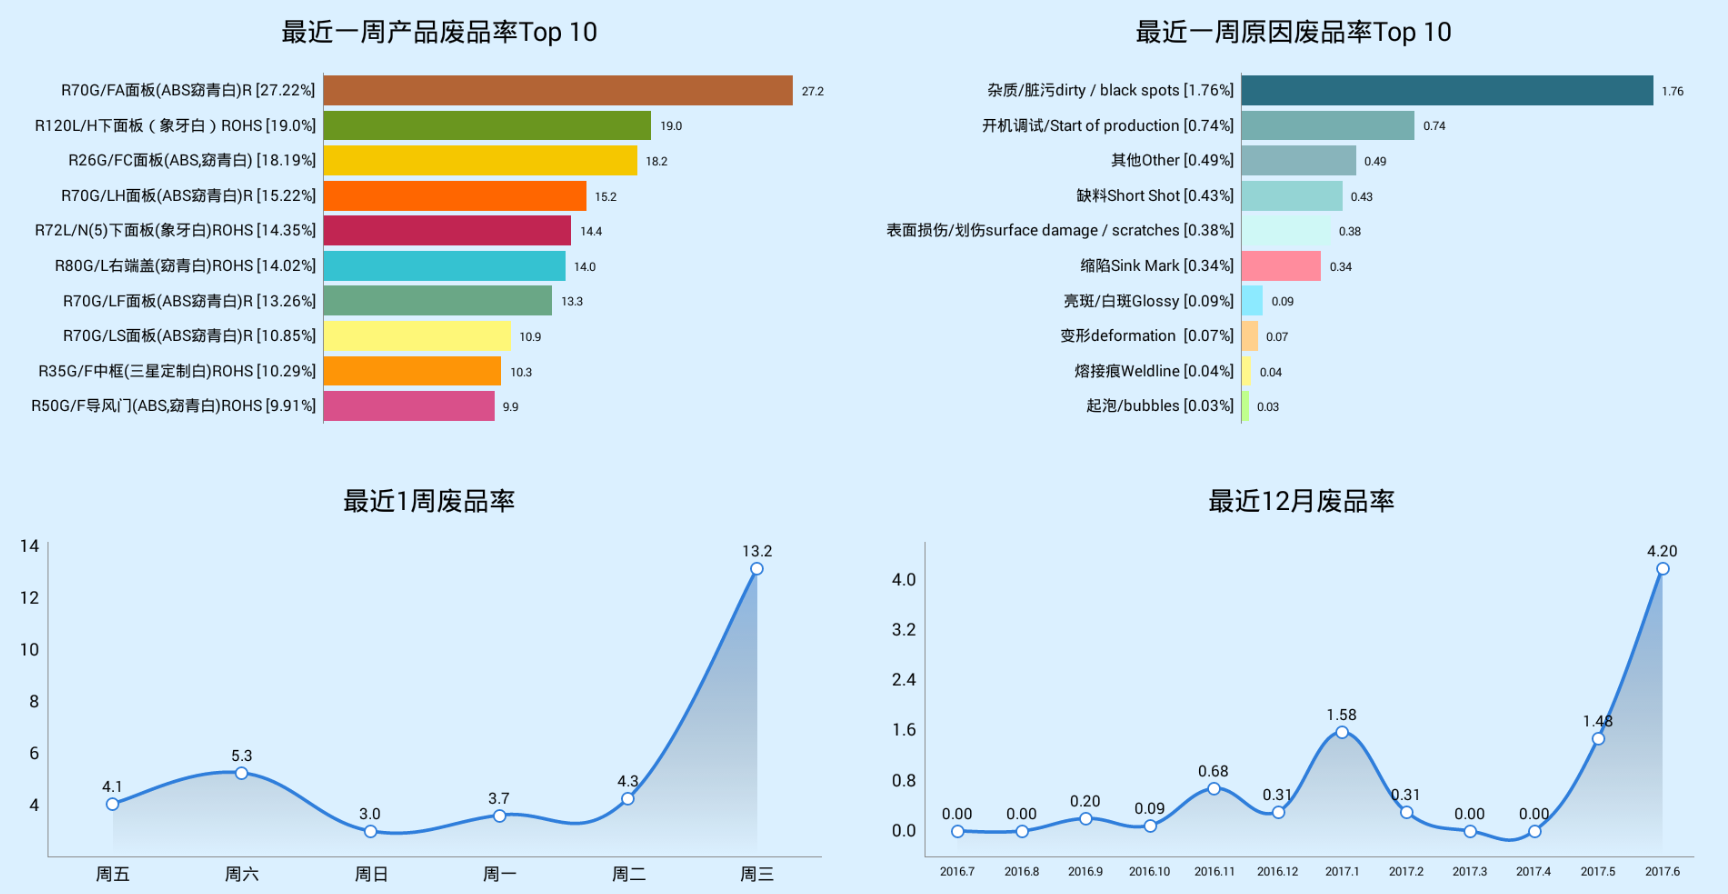
效果图